HKM - Renko Emulator with EMA TrendThis is a Renko based Emulator to plot on any chart type which prints the box as printed on a Renko charts and is a Non-Repaint version. You can use either Traditional or ATR Method on current chart Timeframe. Option to plot an EMA Line is provided with Trend indication.
Cerca negli script per "3 ema"

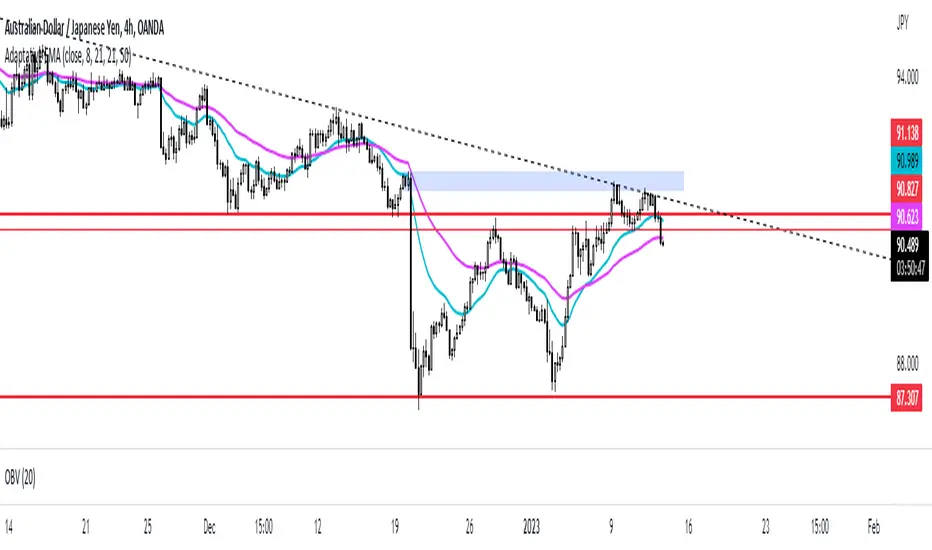
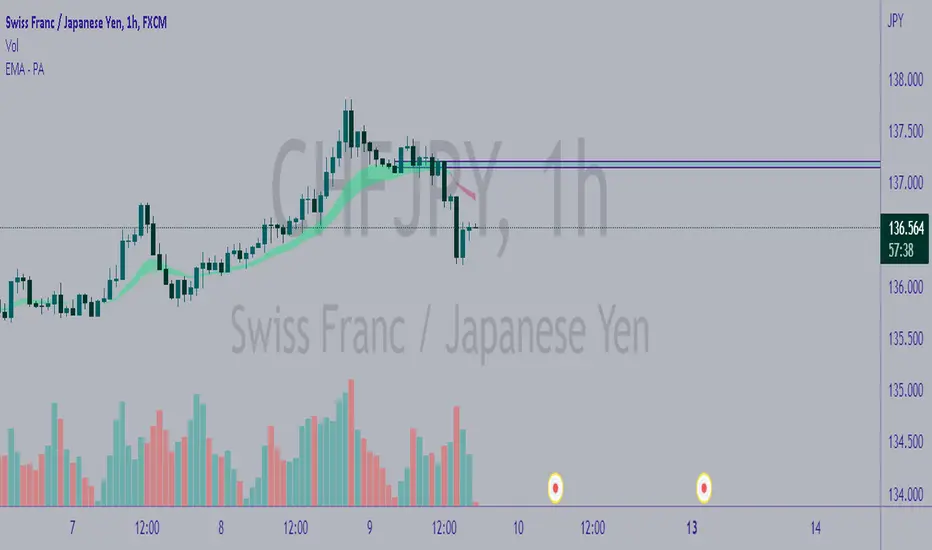
Adaptative EMAThis script prints different EMA if I am on a intraday timeframe or a daily or higher timeframe by using one indicator only.
It helps me to bring confluences for my price action strategy.
Smooth EMA/DEMA/TEMA/EHMA (SEMA)This is my attempt at smoothing the exponential moving average any its cousins. I literally just smoothed the source and alpha and this is what we got. I really like this because you get a nice smooth yet fast acting moving average that works better than a traditional simple moving average. This script also included directional alerts.
Smooth EMA
Smooth DEMA
Smooth TEMA
Smooth EHMA

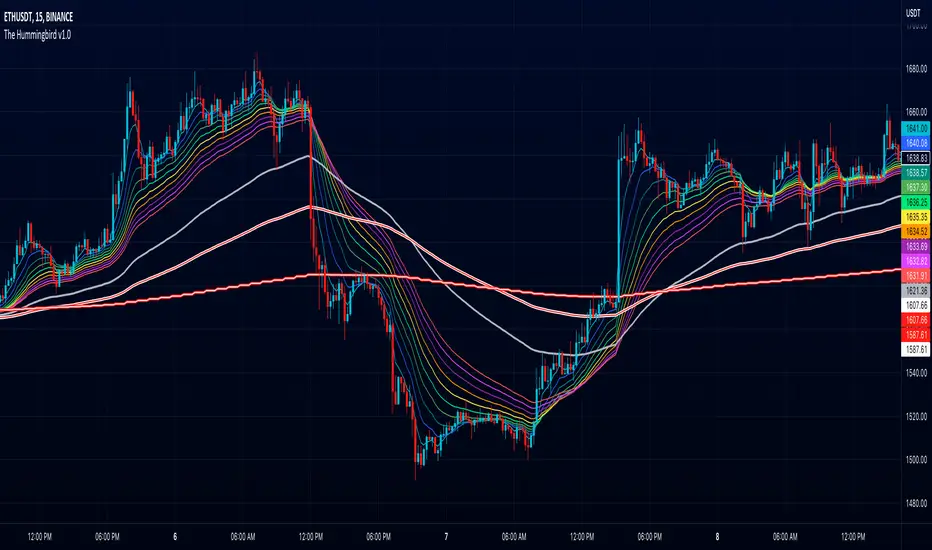
The Hummingbird - MA Ribbon by Joe (EMA, SMA, SMMA, WMA, VWMA)Tired of having to add multiple moving average indicators to your chart? Well, stop doing that. No, really. Listen. Adding duplicate indicators is totally not cool. And, it won't go over well at the next HOA meeting if you keep doing it.
Here's the sweet moving average ribbon you've been waiting for (with 1-10 moving average lines!). It will make your charts look much cooler 😎. And you'll gain the respect of all your neighbors if you add it to your charts.
In all seriousness, this is a slimmed-down version of my other super-awesome script with a stupid name, "Joe's Ultimate MA Ribbon (w/ Crossover Triggers)."
Basically, I removed the crossover signals from it and changed the name to a much superior name, "The Hummingbird."
Yeah. Right on. So, if you don't want or need the crossover signals, go right on humming with "The Hummingbird."
Enjoy, friends. 🍻
If you still want the original ribbon with crossover signals, get it here .
Options:
Show/Hide MA Lines: Only show the lines you wanna see. No more. No less.
MA Type (can be different for each line!): EMA , SMA , SMMA (RMA), WMA , VWMA
MA Source (for each line): open, close, high, low, hl2 , hlc3, ohlc4, hlcc4
MA Length (for each line): any number between 1 and 4999
Line Colors: Ooh, pretty.
Refracted EMARefracted EMA is a price based indicator with bands that is built on moving average.
The price range between the bands directly depends on relationship of Average True Range to Moving Average. This gives us very valuable variable constant that changes with the market moves.
So the bands expand and contract due to changes in volatility of the market, which makes this tool very flexible exposing psychological levels.

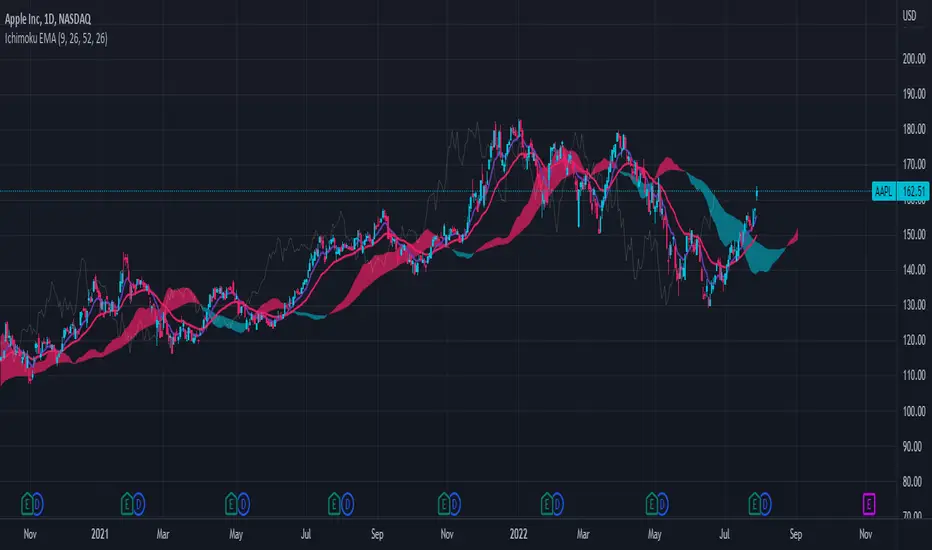
Ichimoku Cloud with EMAThis is a standard Ichimoku Cloud indicator that uses the exponential moving average (EMA) instead of the Tenkan and Kijun Sen.
It provides similar signals as the original but just looks nicer in my opinion.
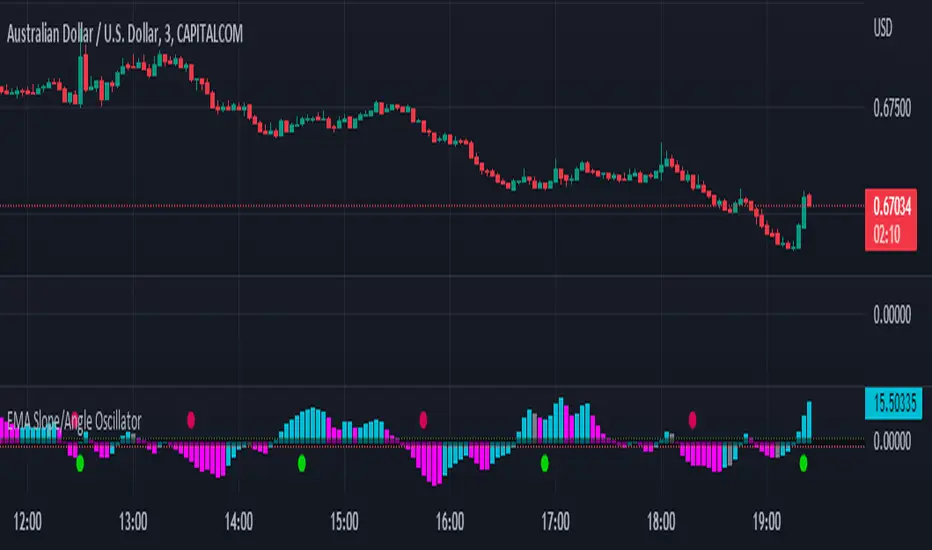
EMA Slope/Angle OscillatorEMA Slope/Angle Oscillator, Multiple Moving Average Oscillator, Multiple type
Moving Averages HMA,EMA,WMA,SMA, VWMA,VWAP provided.
The angle is calculated between the Slow MA and Fast MA and the difference between the angle is plotted as Histogram.
Additionally Buy Sell Signals are plotted as green and red Dots.
its very easy to judge the movement of price Bearish/Bullish.
Bearish if price below 0 line
Bullish if price above 0 line
Zero crossing is Moving Average Crossover.
Trend Filter is provided to filter opposite signals.
Angle Threshold is provided to filter low angle false signals.
Dead zone is plotted around Zero Line. Trades can be taken after Threshold angle or Dead zone is crossed
Its interesting to see how different Moving Averages move along with price Action.
Phase-Accumulation Adaptive EMA w/ Expanded Source Types [Loxx]Phase-Accumulation Adaptive EMA w/ Expanded Source Types is a Phase Accumulation Adaptive Exponential Moving Average with Loxx's Expanded Source Types. This indicator is meant to better capture trend movements using dominant cycle inputs. Alerts are included.
What is Phase Accumulation?
The phase accumulation method of computing the dominant cycle is perhaps the easiest to comprehend. In this technique, we measure the phase at each sample by taking the arctangent of the ratio of the quadrature component to the in-phase component. A delta phase is generated by taking the difference of the phase between successive samples. At each sample we can then look backwards, adding up the delta phases.When the sum of the delta phases reaches 360 degrees, we must have passed through one full cycle, on average.The process is repeated for each new sample.
The phase accumulation method of cycle measurement always uses one full cycle’s worth of historical data.This is both an advantage and a disadvantage.The advantage is the lag in obtaining the answer scales directly with the cycle period.That is, the measurement of a short cycle period has less lag than the measurement of a longer cycle period. However, the number of samples used in making the measurement means the averaging period is variable with cycle period. longer averaging reduces the noise level compared to the signal.Therefore, shorter cycle periods necessarily have a higher out- put signal-to-noise ratio.
Included:
-Toggle on/off bar coloring
-Alerts

SMA EMA Bands [CraftyChaos]This indicator creates bands for SMA and EMA averages and adds an average of the two with the idea that price often touches one of them at support and resistance levels. Saves indicator space by combining all into one indicator

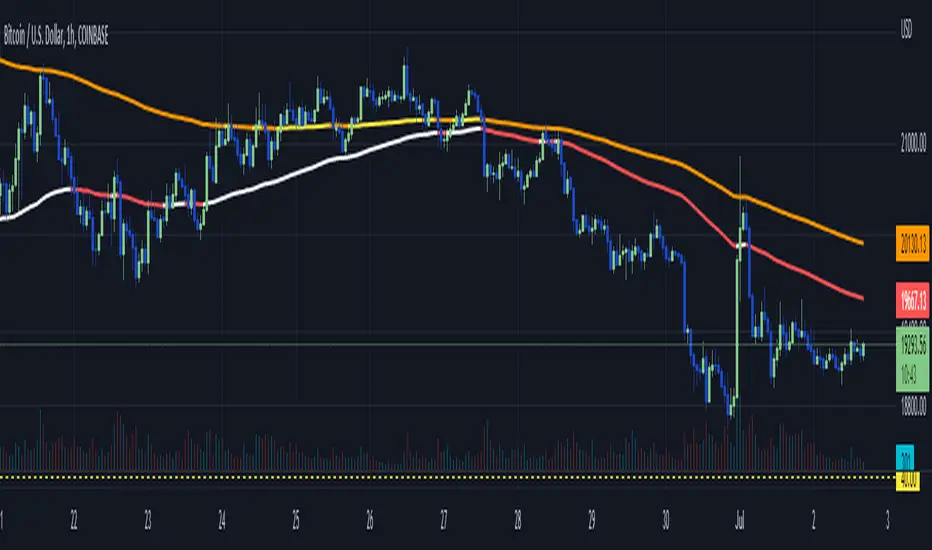
WhiteFang 100 / 200 EMA ColorFlipThis script combines the 100 and 200 EMA and exhibits colour changes ("colour flip") at price action crosses.
The intention here is to create an "at a glance trend indicator" to allow quick and accurate stock, forex and crypto screening prior to selecting targets for entry.
For example I find it prudent to select long when the PA is above both the White (100EMA) and Yellow (200EMA) - conversely selecting short when below Red (100EMA) and Orange (200EAM).
Other attributes:
- Multi timeframe compatible
- Easily to spot:
- golden cross = (white crossing over yellow), and
- Death cross ( red crossing below orange)
((Bullish)) Candle below EMA Hello People of the Trading World...
Todays script is a basic concept of using Moving Averages and Candle Closes - this works best on Higher Timeframes and only in Bullish Conditions
"When the market is trending to the upside - we tend to see price overextend from the moving average and price revert back to the mean (Mean Reversion)"
You may ask why would you want this candle - this presents good opportunities in a trending market (NOT AN ENTRY CANDLE). This can be useful to get into existing trends which you may have missed
This candle will display when the candle close is below one of the below EMAS
9EMA
50EMA
100EMA
You can choose which one to show ie if the 21ema wasnt important but the 100ema was... turn off the 21ema and 50ema and this will display candle below the 100ema
This candle can be alerted in the settings so if price does close you wont miss it.
EXMAPLES:
If you find this script useful please leave a comment and a thumbs up :)

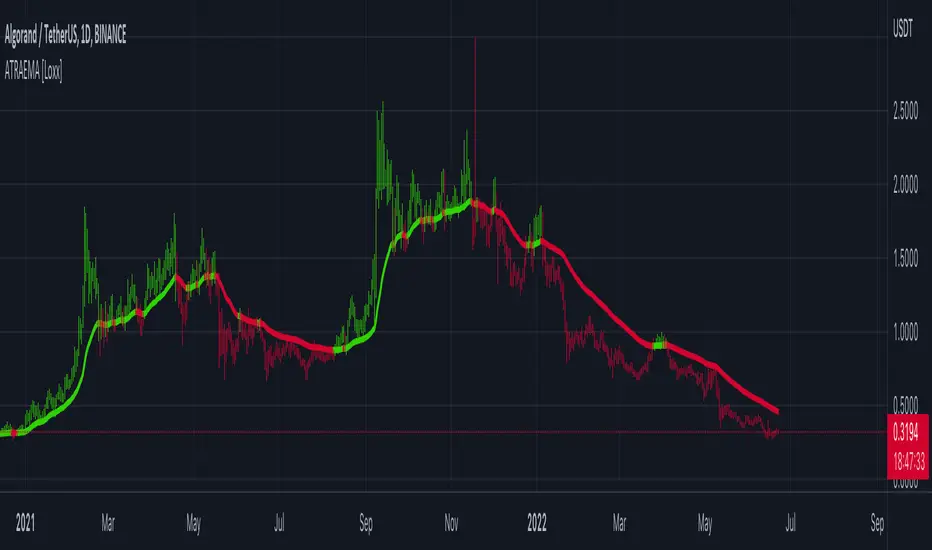
ATR Adaptive EMA [Loxx]ATR adaptive EMA is an exponential moving average with dynamic ATR-adjusted length inputs.
What is Average True Range (ATR)?
The average true range (ATR) is a technical analysis indicator, introduced by market technician J. Welles Wilder Jr. in his book New Concepts in Technical Trading Systems, that measures market volatility by decomposing the entire range of an asset price for that period.1
The true range is taken as the greatest of the following: current high less the current low; the absolute value of the current high less the previous close; and the absolute value of the current low less the previous close. The ATR is then a moving average, generally using 14 days, of the true ranges.
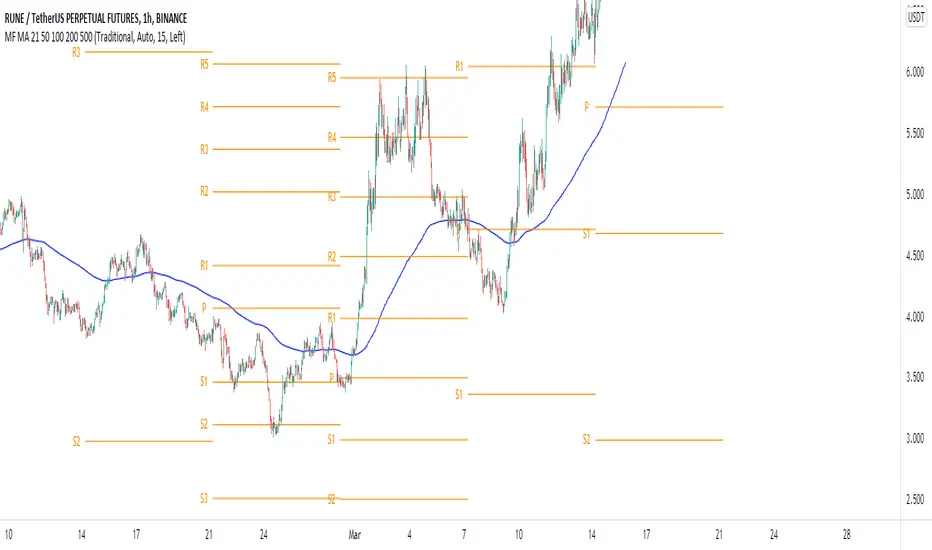
MF 200 EMA PivotPointWe will be using the 200 EMA for identifying the trend of the market & possible cross overs for Swing trades. Pivot points will be really useful for defining the Supports & resistance. By combining with these two strategies we can understand the markets simple & clear. No need to fill your chart with Graphical designs.

Combine & Merge Candlesticks + EMACombine & Merge Candlesticks with EMA
You can do the following:-
1 min - look back 5 (5 min) up to 15 (15 min)
5 min - look back 3 (15 min) up to 12 (1 hour)
15 min - look back 4 (1 hour) up to 16 ( 4 hours)
1 hour - look back 4 (4 hours) up to 8 (8 hours - 1 trading session)
4 hour - look back 2 (8 hours - 1 trading session) up to 6 ( 1 Day)
1 day - look back 5 ( 1 week)

Dynamic Fibonacci Pivot Points & EMA CrossoversI have created this script for those who face difficulties drawing Fibonacci levels as this script is Dynamic so it automatically calculates the ranges based on current High and Lows. I have also added Standard Fibonacci Pivot Points so that we can easily see the confluences between Dynamic and Standard pivot points. Apart from this I have also added EMA Crossovers so that we can easily identify trend changes. You can modify this script as per your own.

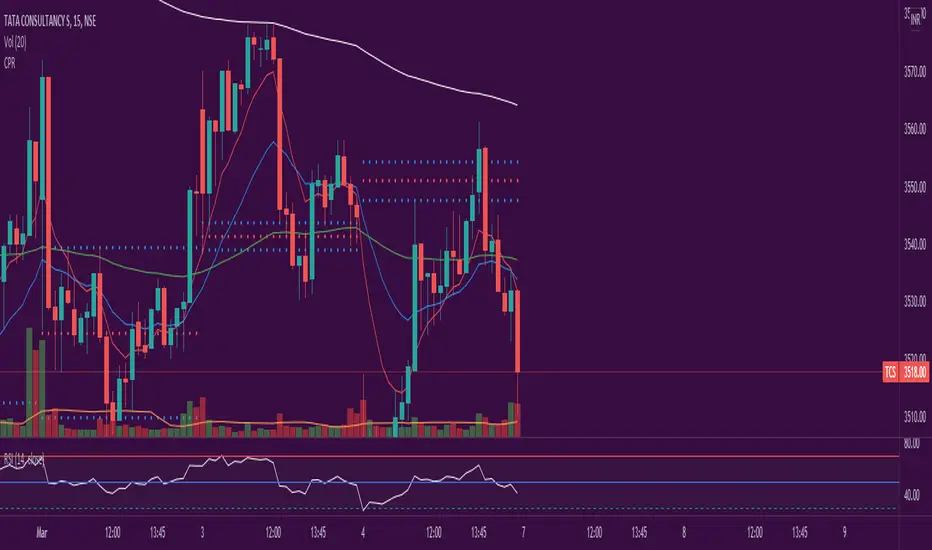
CPR-EMA(8,20,200)The intention behind this Indicator is to combine 2 (EMA & CPR) together so that users having limits on the number of indicators can be benifited

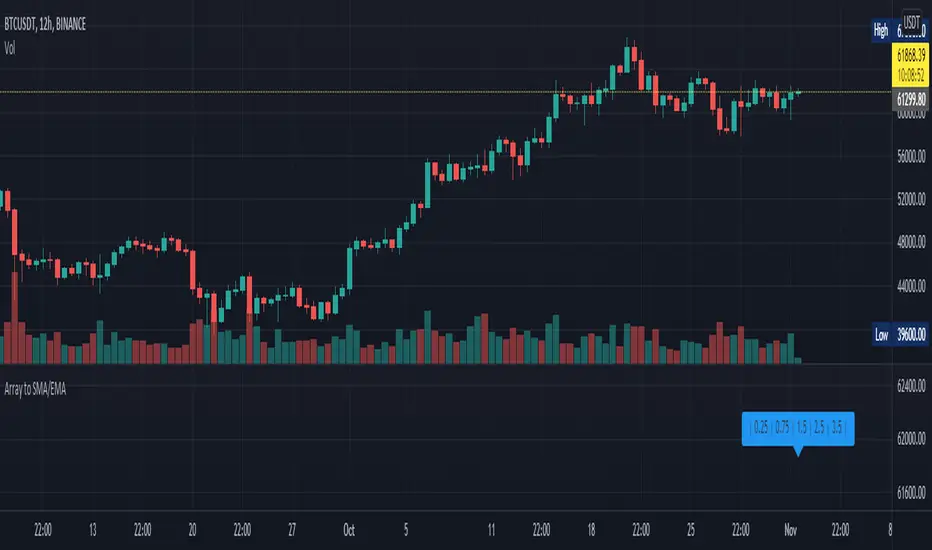
Array to SMA/EMAThis script is to help people with converting arrays to Simple Moving Average and Exponential Moving Average arrays. It is the same as using ta.sma() or ta.ema() in v5 with series but it takes an array as input instead. Both functions have inbuilt bad-input checking logic to ensure that the period length is not too high or too low - which could give unwanted results. If such values are used, the functions will output an array of the same length with NaN values. The EMA function also has an optional argument called sma_seed , which determines whether the first value in the output array will be the SMA of the first value from the input array (true) or the first value itself (false). Both functions work independently of one another, all you have to do is copy the entire function into your code and off you go! I can add more functions such as RMA or VWMA if there is demand, let me know and leave a like! ~ if you want.
Indicator: SMA/EMA (Multi timeframes)This moving average indicator will plot the SMA or EMA sourced from a different timeframe on the current chart.
Applications:
Say you are viewing an hourly chart but you also want to know the ema20 sourced from a higher timeframe (i.e daily) of the same security. The problem with using most built-in indicators is that the MA values are usually calculated from the current chart, so to do that, you will have to toggle between 1h/1D. This script will eliminate this hassle by plotting out the desired alternative timeframe on the same chart.
Dynamic settings
By default the alternative timeframe is 1D, but this can be customized further:
- 1 week chart -> plots out 1 month MA
- 1 day chart -> plots out 1 week MA
- 1 hour chart -> plots out 1 day MA

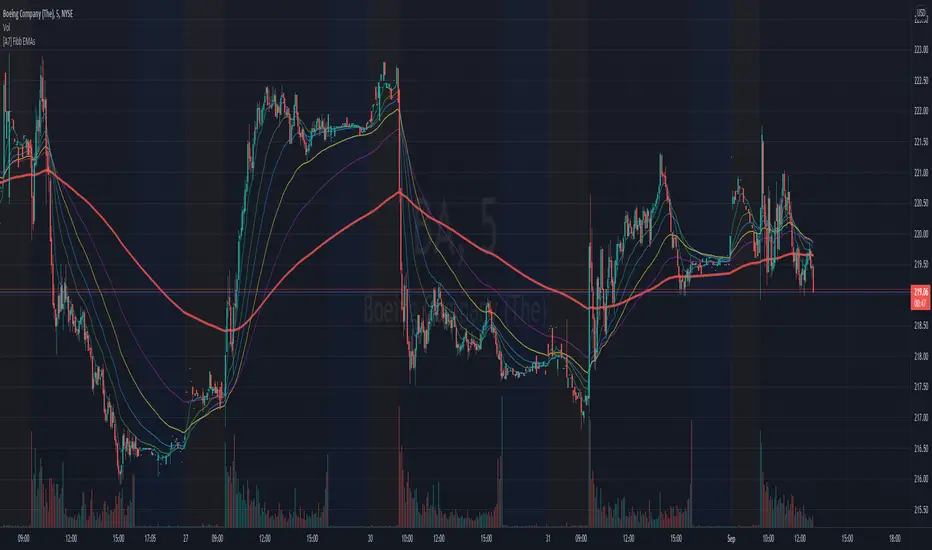
[A7] Fibonacci EMAs (8,21,34,55,89,233) Fibonacci EMAs (8,21,34,55,89,233)
Fibonacci Exponential Moving Averages
8 - aqua
21 - green
34 - blue
55 - yellow
89 - purple
233 - red